Skills needed to be a Data Analyst.
29 May 2024

Does a career in Data require a Tech Background to start? What are the skills required to enter into data analysis and grow?
Let's answer these questions briefly.
Any kind of job/ profession requires 2 kinds of skills- Hard skills and Soft skills. Let’s discover how many of these 2 types of skills are required by Data Analysts.
Hard Skills
Hard skills are the tools, coding languages and software known by a candidate, which can be used to achieve the required objective. In simpler words, whatever capabilities and skills that can be measured are possessed by an individual and can be deployed to function in an organisation are called hard skills.
Programming skills
Data Analysts need to be comfortable handling and manipulating data. They have to work extensively on data collection, cleaning and analysis. For this, programming languages and database tools come in handy. However, these are simple languages and developer-level knowledge of these is not required for data analysis.
SQL is widely used for data retrieval in analysis. SQL seamlessly merges, unmerges, refines and retrieves data from multiple data tables. It also enables the user to use various mathematical operations to perform analytical functions. For example, if you have two data tables, one contains the Product ID and Product Name and the second table contains the Product ID and Product Price. An Analyst can easily retrieve the dataset of Product Names from one table and their respective Product Prices from another table, using the common link of Product ID. This is the magic of SQL and while this can be done using other tools as well, SQL completes this task more seamlessly and conveniently.
Excel is used for storing large datasets and can be used in a variety of ways for analysis, from cleaning to visualisation. However, very complex data is difficult to handle in Excel for analysis. It does not entirely come under programming, but the use of functions is very important for data analysis in Excel. Take the example of the below dataset-
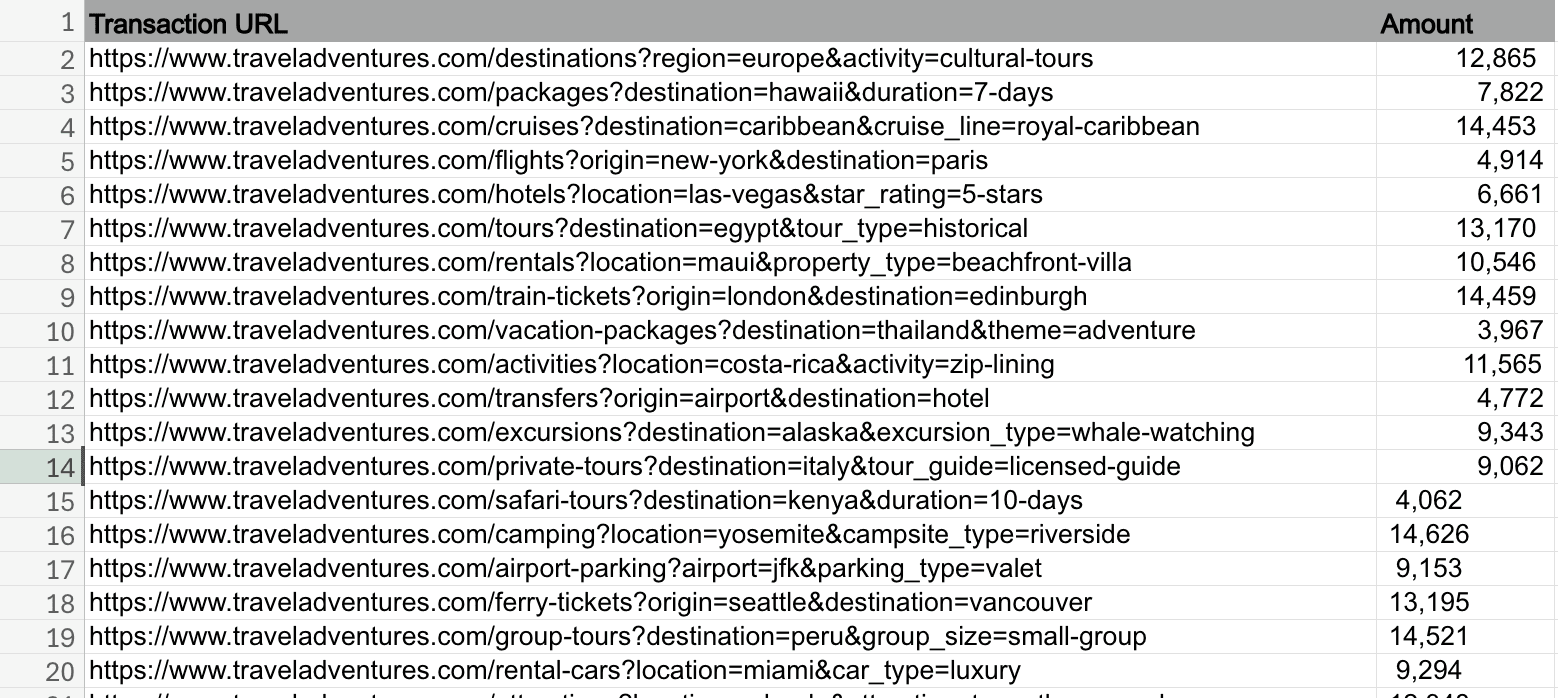
This unstructured data can be cleaned and analysed using Excel. However, it will longer than other tools since the data is unstructured and does not follow any particular pattern, which makes it difficult to use for very complex datasets.
Python is very useful for managing complex data due to its data libraries that conveniently convert unstructured data into structured datasets. Also, it is one of the easiest languages to learn and hence is a very handy tool for any analyst. Taking the same dataset as in the above paragraph, it is easier to clean using libraries like Pandas in Python. Pandas is a library that is specifically designed to handle data like this and much more.
R is a similar language to Python in terms of learning. However, R is more popular for statistical analysis and visualisation of data. Similar to Python, it uses several built-in packages to convert unstructured data into structured format. The packages in R are specifically designed to conduct statistical analyses like Correlation Analysis, Regression Analysis and Hypothesis Testing (explained briefly below).
Visualisation skills
After retrieving, cleaning and analysing the data, the analyst must also convey their findings to the stakeholders. However, it will be very difficult to do it with the working tables and reports built during the process of analysis. For this, analysts must use visualization tools.
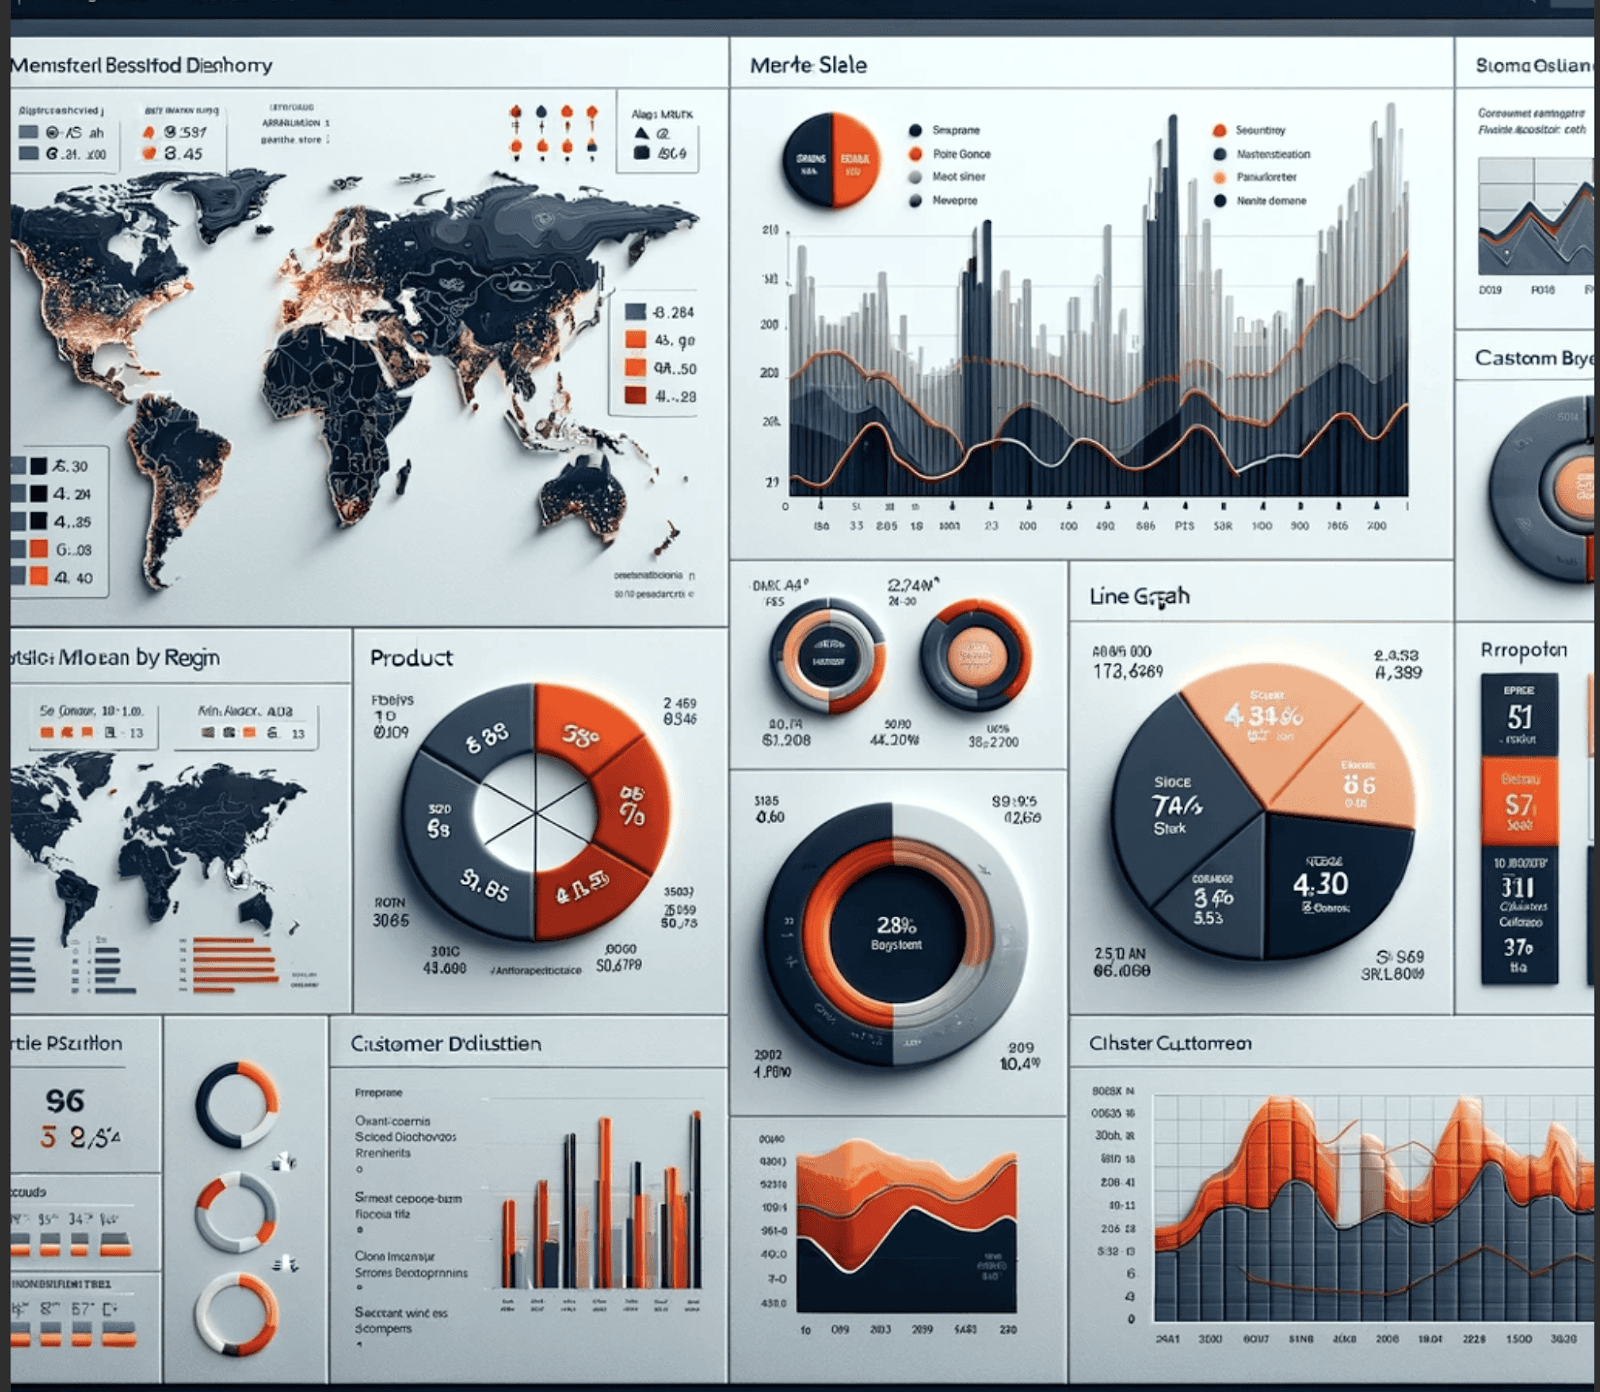
Tableau is the most used visualisation tool by analysts due to its user-friendly interface. Also, you don’t need any coding skills to create complex visualisation charts, graphs and dashboards! It is easy to learn and use and can be used to visualise large datasets as well. Dashboards as comprehensive as the one given below can be developed using Tableau from Scratch!
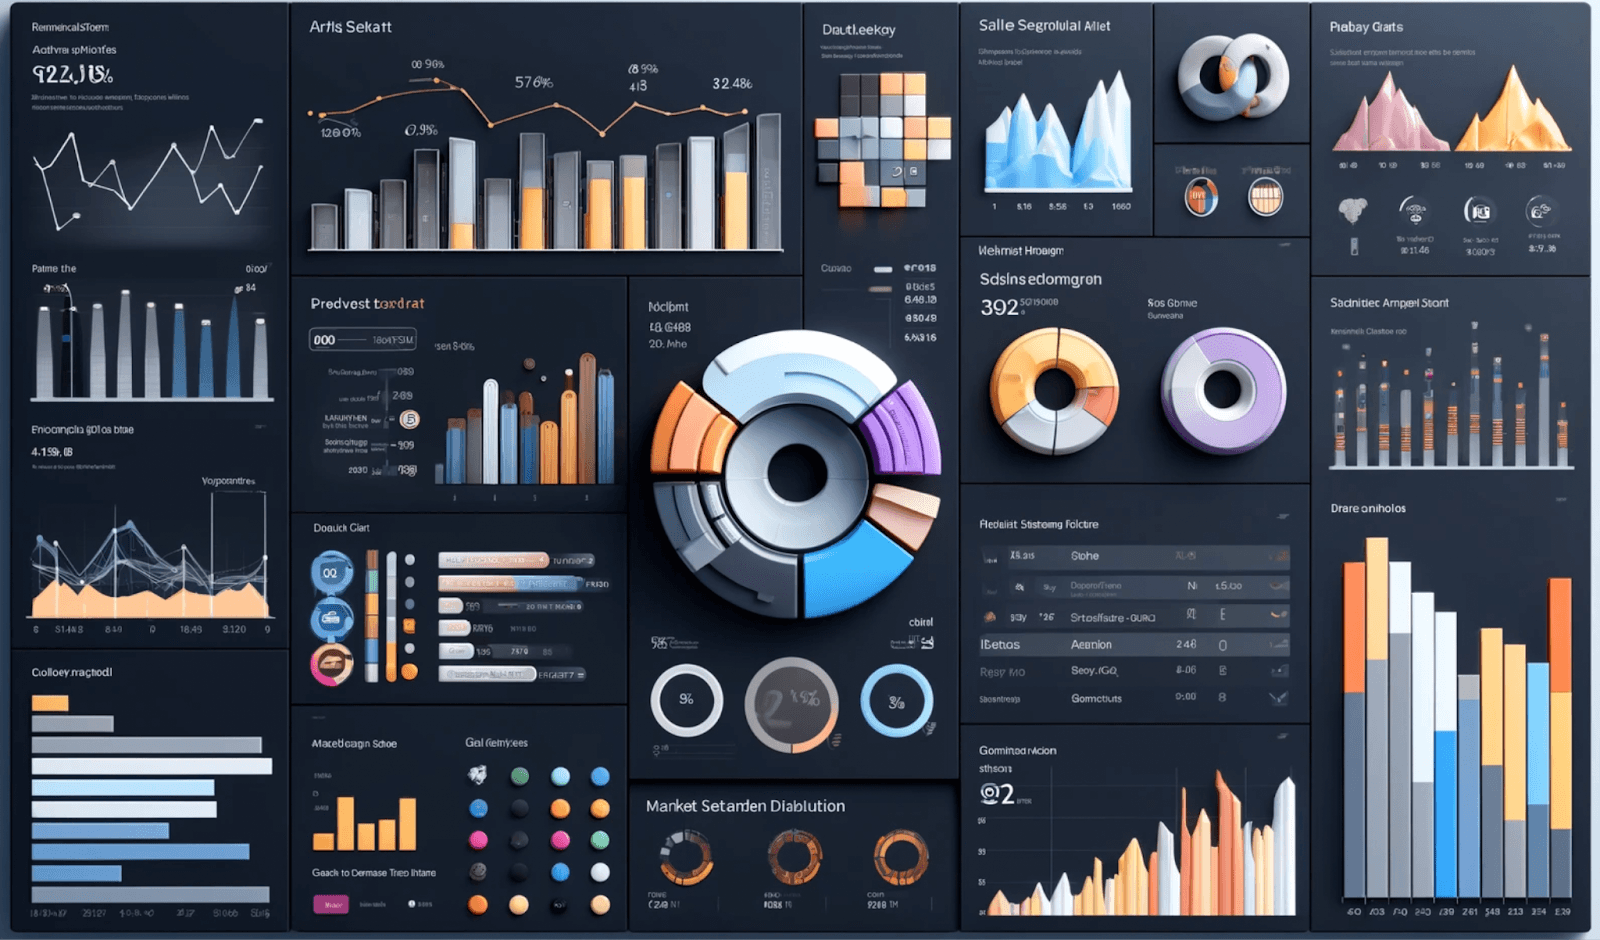
Power BI is another great tool for data visualisation. Although Tableau works more efficiently with larger datasets, Power BI works faster with smaller datasets. The interface of Power BI is similar to Excel and is great for collaborating and sharing with the team. Power BI, like Tableau, does not necessarily require coding. An example of of Power BI dashboard is shown in the image below.
Excel is lesser used tool for visualisation as cannot visualise large datasets as efficiently as the above two tools can and is also not very convenient for collaborations. However, with smaller datasets, Excel works decently and can be used for preparing dynamic data dashboards as well.
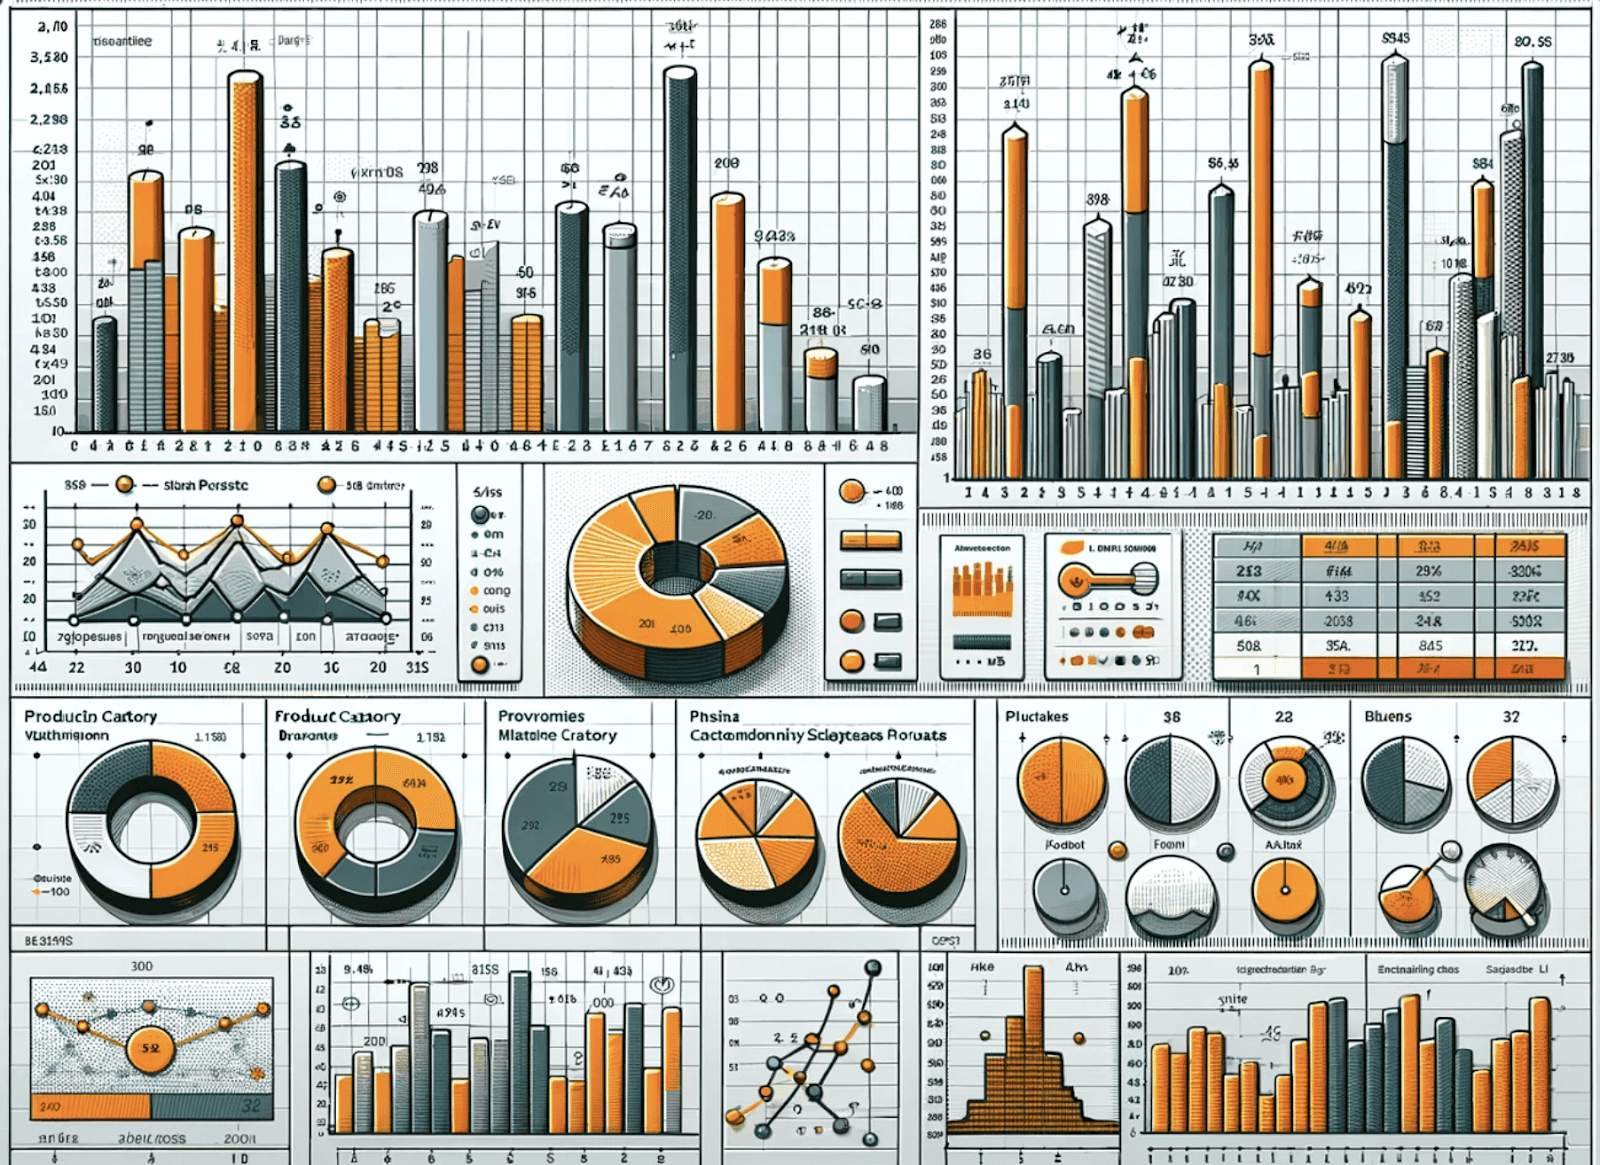
Above is an example of a Dashboard made in Excel.
As you can see from the above images, very comprehensive, interactive and dynamic dashboards can be made using these three tools. However, each handles the data required to make these dashboards differently. Let’s understand how these tools are different from each other from the below table-
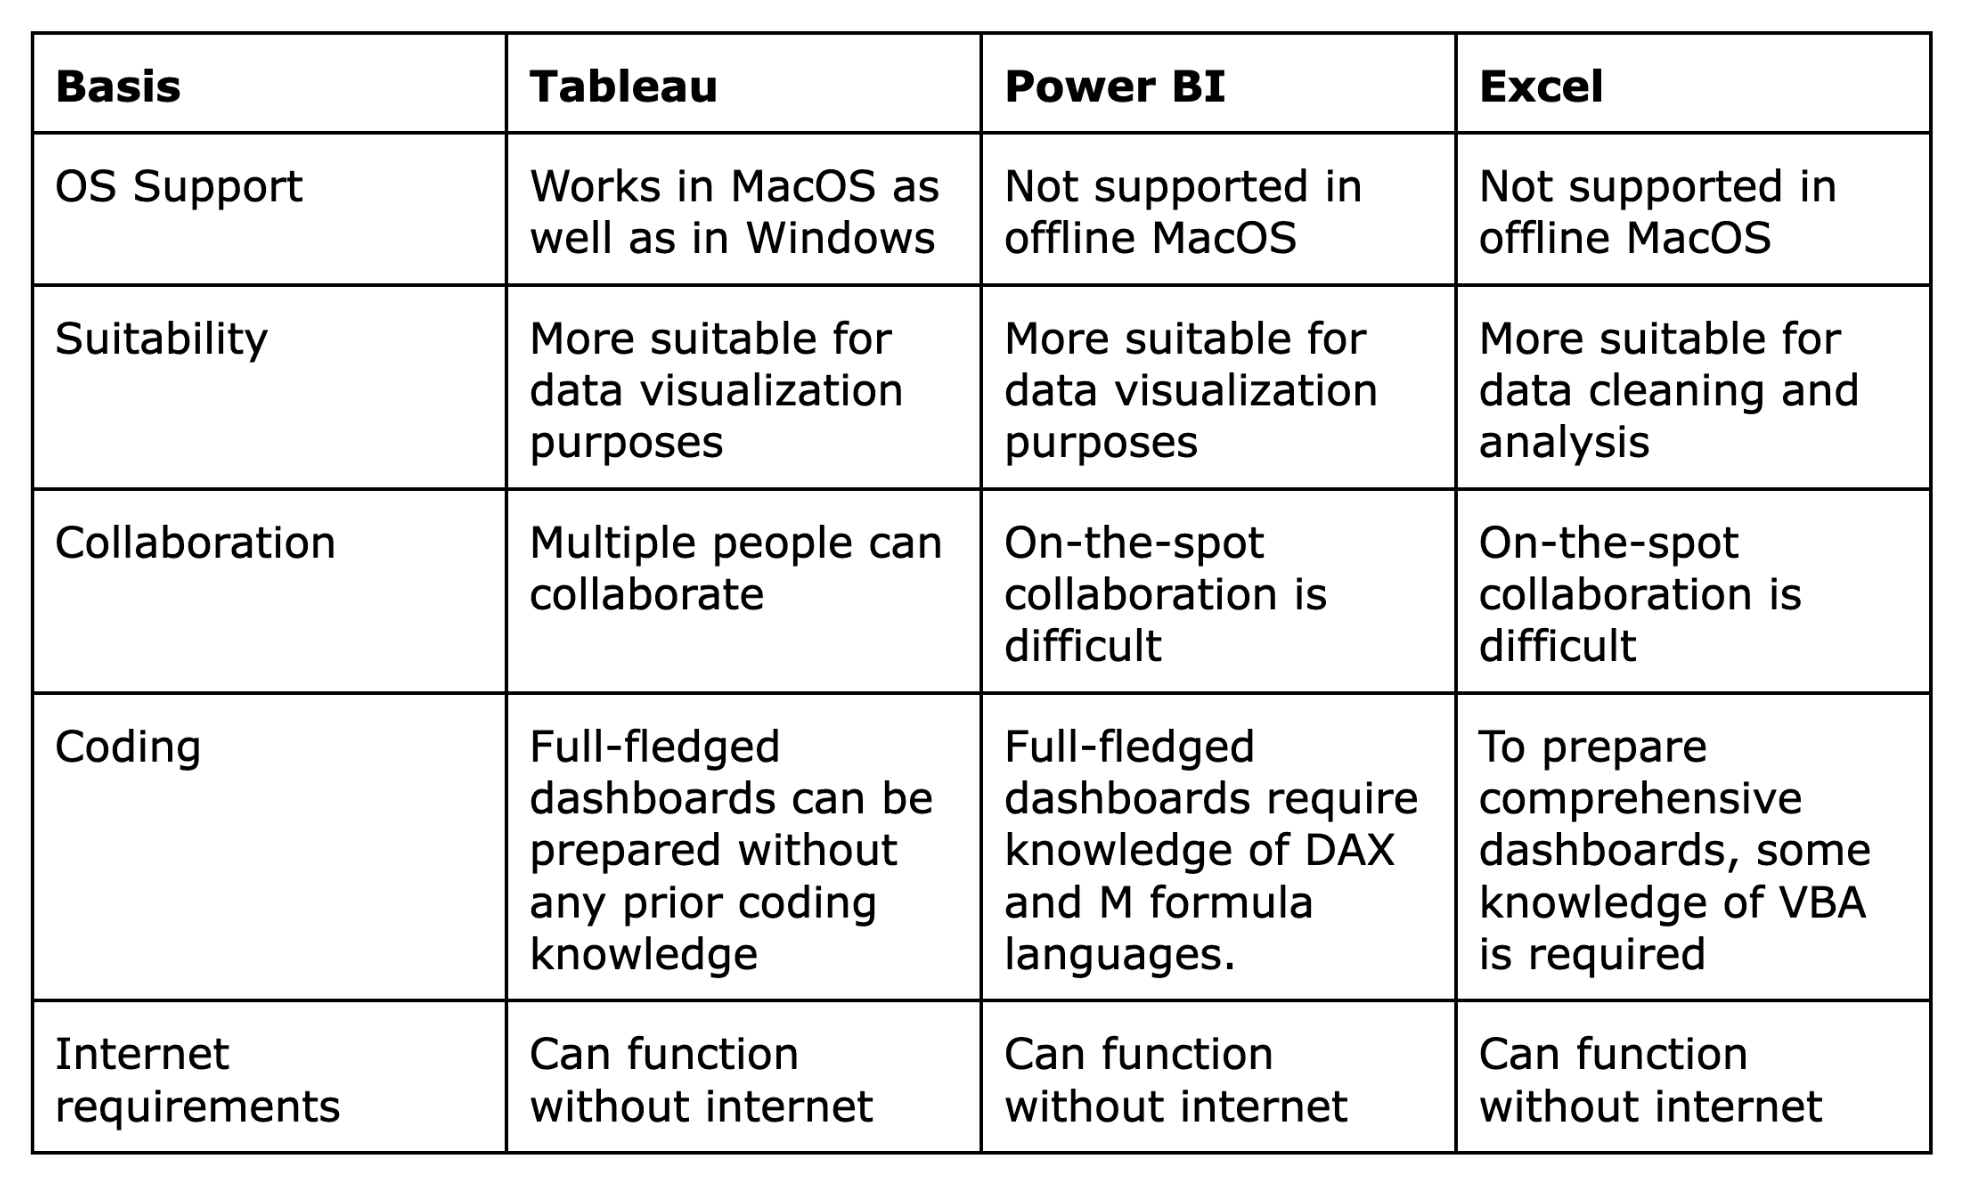
Statistical knowledge
An analyst requires statistical knowledge to establish and test their findings from the analysis process. Statistical knowledge for data analysts is like having a set of tools to understand and make sense of data. If you're a detective trying to solve a mystery using clues, then clues are numbers and patterns in the data. This statistical knowledge involves the requirement of the following analyses-
Correlation Analysis Correlation analysis is a way to find out if there is a relationship between two things and how strong that relationship is. Imagine you want to know if studying more hours leads to better test scores. By using correlation analysis, you can see if students who study more tend to get higher scores.
Regression Analysis Regression analysis is a way to understand how one thing affects another. Taking the above example, regression analysis will also give you an amount of variance, that is, by how much each extra hour increases your scores.
Hypothesis Testing is assessing whether an assumption about a population is true or not based on tests run on a sample population. In simple words, Hypothesis testing is like being a detective trying to figure out if something is true or not. Imagine you have a hunch that eating breakfast every day makes you more energetic. Hypothesis testing helps you find out if your hunch is right or if it's just a coincidence.
4. Domain knowledge
Domain knowledge is the organisation's awareness, be it the operations, financing, strategies or the environment and competitors. Domain knowledge is important information for the analyst to account for in their findings and make them more accurate. It can broadly be of two types- Internal and External.
Internal Domain Knowledge or the inside operations and functioning of the organisation is important for the analyst to retrieve relevant and organisation-specific data for analysis.
External Domain Knowledge is the knowledge of the organisation’s external environment, to identify the factors that might influence the organisation's functions in the present or future and account for that in the analysis.
Soft skills
Communication skills
Communication skills are an asset for any analyst, even though the initial jobs usually don’t filter candidates based on this. It is an important skill to have in the job and can result in higher growth prospects for the candidates.
Verbal communication is the method of communication where the person has to talk to convey the message. Good verbal communication enables the analyst to explain their data models and findings more easily to the stakeholders and hence is essential.
Non-verbal communication is the method of communication where the person communicates without using words. Common forms of this type are hand gestures, body posture and facial expressions. Never underestimate the power of nonverbal communication as 70% to 93% of the overall communication is nonverbal in nature.
Written Communication is a form of communication that can be conveyed through reports, minutes and drafts. Clear-cut communication here is important to avoid any misunderstandings and misinterpretation of data.
Presentation Skills are a necessary set of skills which is a mix of verbal, non-verbal and written communication. However, being excellent in all three of them does not ensure that your presentation skills are on par as well. It requires practice and confidence to ace this type of skill, due to its very particular communication requirements.
Problem Solving skills
Critical thinking is the ability to objectively analyze and evaluate issues to form a judgment.
Analytical reasoning means using logical reasoning to approach problems and make decisions based on data.
Innovation as sometimes, traditional methods won't cut it, and you'll need to think outside the box as an analyst to complete the task at hand.
Attention to detail
Last but not least, attention to detail is crucial to avoid any error or blunder in the analysis and communication process. Organisations make major decisions based on data analysis and any error in this process can cost the organisation dearly.
The role of a Data Analyst is a very versatile one, from Data handling to Communication, everything is a must-know for an analyst to succeed in a long-term career. Due to the growing demands and dynamism of the industry, analysts are required to constantly evolve with the markets and keep learning. However, it has a very relevant role in the contemporary world and has high growth potential. Roles like CDO, Senior Data Engineer and Data Scientist barely existed a decade ago, but are running large MNCs like Netflix and Meta now. A career in this field is a highly rewarding one, and the best part? It does not require a Tech Background to start!